If you are reading this article, then you should be well aware that there are various and different types of network devices, servers, electronic gadgets, transport mediums, media converters, etc, which are somehow connected to each other to form the Internet.
The internet is the biggest network in the world consisting of billions of computers, servers, workstations, routers, switches, printers, mainframes, mobile devices, etc, connected to each other in one way or another.
1 question certainly arises, which is, how do we keep track of this giant network and it’s billions of network devices connected to the Internet?
If you are a system administrator, then I’m sure you are in charge of maintaining at least a couple of servers and network devices such as a router. In truth, a system administrator’s job is unlimited and sad but truth is also thankless job. We look after a lot of different servers ranging from web servers, proxy servers, dns servers, mail servers just to name a few. In fact, any given system administrator could well be managing any where from 5 to 500 different kinds of servers and network devices.
On average, a single server could be serving approximately 500 users. Hence if one of your server should go down, then 500 people will be banging your phone and speaking some horrible or alien language to you!
If you add 2 dozen more servers and network devices and for some reason they should go down, then that’s when you know that you are in real deep trouble!
So how do we keep ourselves sane and how to we keep ourselves informed if all our servers and network services are working in fine shape and condition. The answer is to use a host and service monitoring system designed to inform us of network problems before our clients, end-users or managers do!
There are various different tools used for monitoring servers and network devices out of which the 2 best known tools are Nagios and Zabbix.
In a nutshell,
Nagios is a popular open source computer system and network monitoring application software. It watches hosts and services that you specify, alerting you when things go bad and again when they get better.
It can be used for monitoring of network services (SMTP, POP3, HTTP, NNTP, ICMP, SNMP, FTP, SSH, etc) .
The best part of it is that it supports simple plugins designed to allow users to easily develop their own service checks depending on needs, by using the tools of choice (Bash, C++, Perl, Ruby, Python, PHP, C#, etc.)
Zabbix is also an open source network monitoring system designed to monitor and track the status of various network services, servers, and other network hardware. The main difference between Nagios and Zabbix is that Zabbix uses MySQL, PostgreSQL, SQLite or Oracle to store data. Its web based frontend is written in PHP.
The point to note is that whichever tool you choose to use, the tool must allow us to be constantly aware of change in our environment to which we should be aware and to record data points over a period of time to allow for trend analysis, capacity planning, and fault isolation down the road.
In this article, we will go about installing and configuring Nagios for monitoring our network devices and servers.
For Nagios to work, you must have an existing Apache web server running. If not, then simply follow the steps below to configure a simple running Apache-2.2.6 web server:
(1.) Add User and Group “apache” and download Apache-2.2.6
groupadd apache
useradd -g apache apache
mkdir -p /usr/local/src/httpd
cd /usr/local/src/httpd
wget http://mirror.nyi.net/apache/httpd/httpd-2.2.6.tar.gz
(2.) unzip the sources
tar zxvf httpd-2.2.6.tar.gz
(3.) Configure Apache
cd httpd-2.2.6
./configure
–prefix=/usr/local/httpd \
–enable-so
(4.) Compile and install Apache
make && make install
(5.) Start the Apache web server
/usr/local/httpd/bin/apachectl start
That’s it. Apache 2.2.6 should now be running!
NAGIOS INSTALLATION
Now that our web server is running, we move on to the installation of Nagios itself.
(1.) Create the user “nagios” and group “nagcmd”. Then add user “nagios” and “apache” to the nagcmd group.
useradd nagios
groupadd nagcmd
usermod -G nagcmd nagios
usermod -G nagcmd apache
(2.) Download the latest version of Nagios to your regular download directory. As of 01-Jan-2008, the latest version of Nagios is nagios-3.0rc1. We also have to download the nagios-plugins.
mkdir -p /usr/local/src/nagios
cd /usr/local/src/nagios
wget http://superb-east.dl.sourceforge.net/sourceforge/nagios/nagios-3.0rc1.tar.gz
wget http://nchc.dl.sourceforge.net/sourceforge/nagiosplug/nagios-plugins-1.4.11.tar.gz
(3.) Unzip and unpack the sources files.
cd /usr/local/src/nagios
tar zxvf /usr/local/src/nagios/nagios-3.0rc1.tar.gz
(4.) Configure your nagios installation
cd /usr/local/src/nagios/nagios-3.0rc1
./configure –prefix=/usr/local/nagios \
–with-nagios-user=nagios \
–with-nagios-group=nagios \
–with-cgiurl=/usr/local/nagios/share/nagios/cgi-bin
(5.) Compile and make install
make all
(6.) Install binaries, init script, sample config files and set permissions on the external command directory.
make install
make install-init
make install-config
make install-commandmode
(7.) Configure admin email address
vi /usr/local/nagios/etc/objects/contacts.cfg
###Change the following###
email nagios@localhost
to
email tekbdrlimbu@hotmail.com
(8.) Configure the Web interface
ln -s /usr/local/httpd/conf /etc/httpd
ln -s /usr/local/httpd/conf /etc/httpd
cd /usr/local/src/nagios/nagios-3.0rc1
make install-webconf
(9.) Add password to username “nagiosadmin”
/usr/local/httpd/bin/htpasswd -c /usr/local/nagios/etc/htpasswd.users nagiosadmin
(10.) Unzip and unpack the nagios plugins
cd /usr/local/src/nagios
tar zxvf /usr/local/src/nagios/nagios-plugins-1.4.11.tar.gz
cd /usr/local/src/nagios/nagios-plugins-1.4.11/
(11.) Run configure
./configure –with-nagios-user=nagios –with-nagios-group=nagios
(12.) Compile and make install
make
make install
(13.) Verify Nagios configuration files and rung Nagios in Daemon mode
/usr/local/nagios/bin/nagios -v /usr/local/nagios/etc/nagios.cfg
/usr/local/nagios/bin/nagios -d /usr/local/nagios/etc/nagios.cfg
(14.) Copy the Nagios config files to Apache config directory
cp /usr/local/nagios/etc/nagios.cfg /usr/local/httpd/conf/
(15.) Include nagios.conf in your httpd.conf file and restart Apache
vi /usr/local/httpd/conf/httpd.conf
##Add the following line to httpd.conf###
Include /usr/local/httpd/conf/nagios.conf
###Save httpd.conf and exit and restart Apache###
/usr/local/httpd/bin/apachectl restart
(16.) Fire your web browser to check your Nagios installation
http://localhost/nagios
or
http://192.168.0.1/nagios
You should see something like the following:
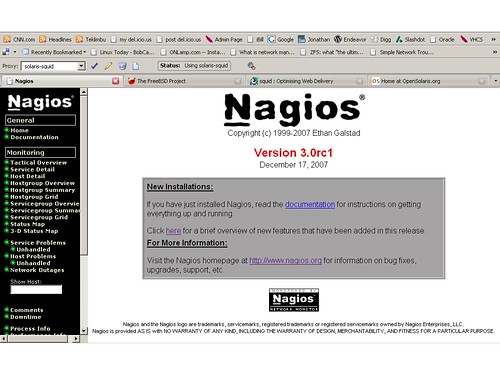
Nagios initial screen
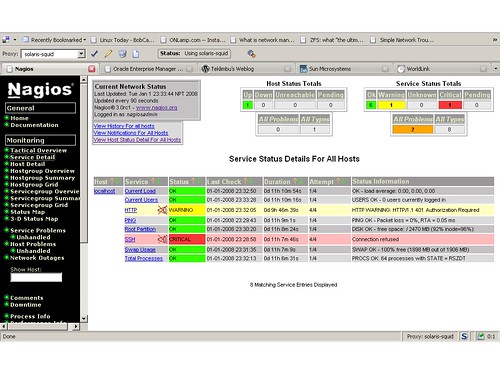
Nagios Service Detail Screenshot
That’s it. Nagios is installed now. Next we will go about configuring checks on various hosts and network devices on our network.